
How to Enter Data in SPSS?
SPSS is an efficient statistical analysis tool used by health researchers, market researchers, government, educationists, survey companies, data miners, and many others. The original SPSS manual is termed as “Sociologies most influential book”.
SPSS is a leading software tool utilized by data managing officers to create, select, document, and reshape data inaccurate manner. SPSS statistics proves useful in processing several data types by simple programming formulas. It has a two-dimensional table structure, where variables and cases represent measurement scales. The case usually involves households or individuals and variables consist of sex or age or gender. Only two kinds of data are used i.e. text and numeric. Every part of the data needs to be processed case by case. Files can be matched one-to-many and one-to-one but not in the sequence of many-to-many. In addition to the case by variables processing and structure there exist many separate matrix sessions where one can process more complex datasets using algebra operations.
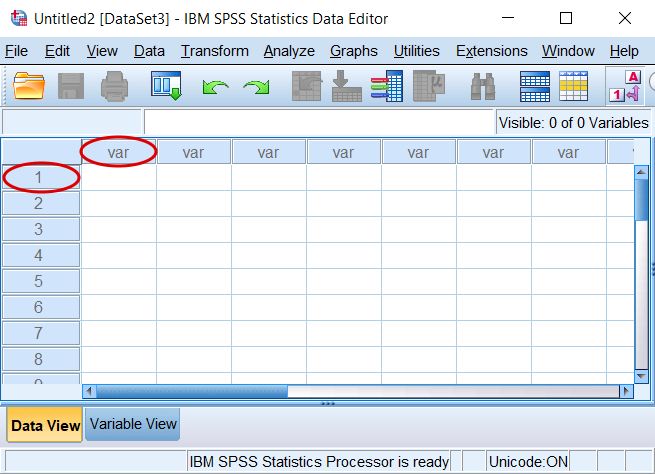
As soon as you open the SPSS program, you will come across a white (blank) spreadsheet as your data view. If you already have a preset data file, in this case, you can open it in SPSS by clicking File>Downloads>Data otherwise to create a new datasheet you must press the option File>New>Data and a blank spreadsheet becomes visible for data entry. You will notice labeling of columns as “var” this is because the data entered in these columns act as variables in the dataset. Also, each row is labeled concerning numbers like (1, 2, 3, 4, 5…) and so on. These rows represent cases that are a part of the dataset. As you begin entering data in the corresponding datasets, the value will be calculated about a specific case (row) and a specific variable (column).
How To Enter Data In SPSS
To enter data you must enter the below-mentioned steps:
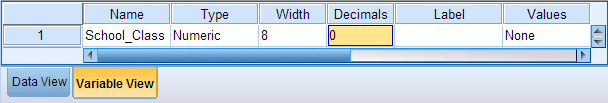
Click the variable view option and simply type the name of the first variable in your dataset in the first column section. Other information regarding the variable can also be filled in the section. Like width, liable, decimals, etc. You need to type every variable name in a column one by one to complete your dataset.
In this example, ‘Social_Class’ act as a variable for every student level like:
1= first year, 2= second year, 3= third year, 4=fourth year, and so on. In the example, 0 decimals will also be specified to include all whole numbers. The default action is two decimals.
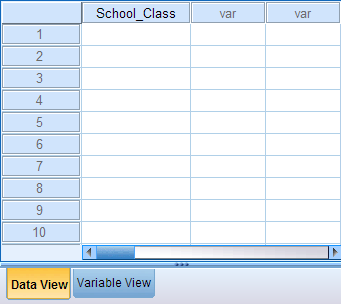
Click on the Data View section. In the tab to view variable names which you had entered in the variable view within the column section. You can see the entire datasheet of School_Class in the first column as shown in the below example:
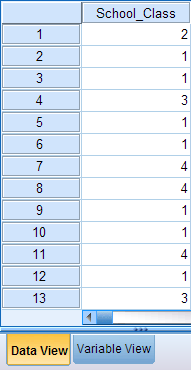
Now it is time to enter all data values in each case to get a satisfactory statistical data analysis of your data set. Here in the example, cases represent students. For every student, you must enter data value in their respective class level in the cells such that each row value corresponds to the column value. For example, the first person value must appear in the first row under our selected variable School_Class. The first person class level is 2, the second person is 1, the third person is also 1, and the fourth person is 3, and so on.
You must repeat all these prescribed steps to include values of every variable in the corresponding column. Note that you must periodically save the data progress in your entire data.
INSERTING A VARIABLE
To create a new variable in the dataset you must:
Click the column name to the place where you want the next variable to be inserted.
You can also insert a variable in other ways:
By selecting Edit > Insert Variable
By right-clicking on the already existent variable name and then opt for the Insert Variable option
Click the option Insert Variable icon directly ( ![]() )
)
By doing so a blank new column will appear on the very left of the cell you selected.
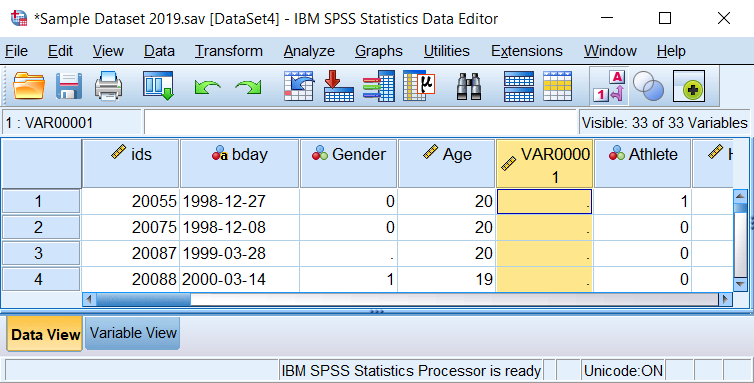
Any new variable will be awarded a generic name like for example VAR00001. You can change the name by opening the Variable View Tab. You can make your way to the Variable View screen by clicking on the generic variable name at the very top of the selected column. Under the ‘Name’ column you can change the variable name. You can also effectively define variable properties such as label, type, and values at one time. All the variable values that are left unattended are indicated with a “.” in each cell within the Data View since you have not inserted any specific variable values in those columns. However, you can enter your intended values by simply typing them within the columns yourself in association with each case (row).
/*Compute new variable containing blanks (system-missing values).*/
COMPUTE newvar=$SYSMIS.
EXECUTE.
/*Reorder the variables to place the new variable in the desired position.*/
MATCH FILES
FILE = *
/KEEP = ids newvar ALL.
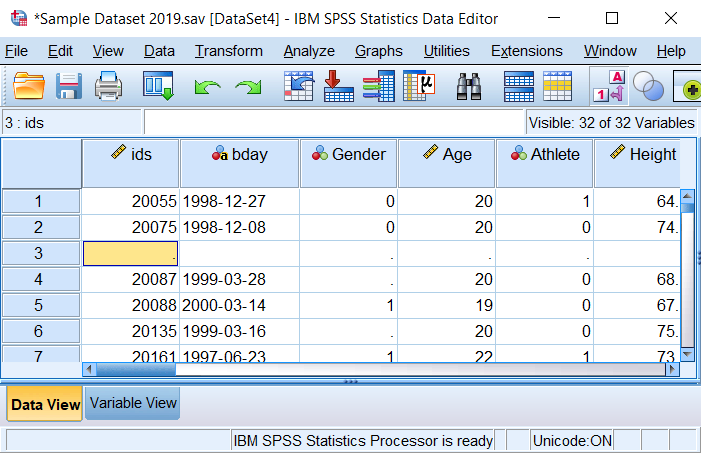
INSERTING A CASE
Now let us begin by inserting a case into the dataset:
In the Data View, click on the individual or row number cells to insert new rows, there are many ways to insert a case such as:
Click the action, Edit > Insert Cases
Right-click on a selected row and opt for the action Insert Cases from the menu bar
Click on the Insert Cases icon ( ![]() ).
).
A blank row will be created above the row that you have selected. Now you can enter values in sync with existing variable values in the dataset. The non-existing case values will be automatically represented by “.” or a blank cell. By entering new information within these rows you can generate new cases on your own.
Complete the data table by adding new values for each variable in the row.
Conclusion –
This blog presents a clear picture with examples to enter questionnaire data within SPSS for better research. SPSS program proves useful in carrying statistical data analysis for your varying datasets. You can enter questionnaire data values in the form of variables (columns) and cases (rows). There are many data analysis options to do statistical measurements of dataset values like questionnaires, pie charts, chi squire, and much more. To get accurate data analysis results one must enter precise variables and case values rather than relying on estimated information.
How ITS Can Help You With Data Entry Service?
Information Transformation Service (ITS) provides convenient Data Entry Solutions regardless of any additional investment of staff, resources, or infrastructure. By outsourcing your Data Entry Projects to us your company will be blessed with high-quality and diverse data entry-related options. Such quality service enables your data to be entered in various desirable formats with repetitive, inaccurate, incomplete, grammatically nonsensical words replaced to form better semantic clarity and understanding. Irrespective of the size and complexity ITS Team defines customized packages to directly answer specifically your business big data projects. If you are interested in getting ITS Data Entry Services you can ask for a free quote!