How to create a data model using MS Excel?
MS Excel is the most frequently used program in nearly every business and data entry service. It is the best spreadsheet software available; Microsoft Excel has many benefits for everyone who can utilize it. In this article, we will look at the most widely-used features in MS Excel: how to build a data model in MS Excel.
What is MS Excel?
Excel can be described as a spreadsheet application developed by Microsoft and a part of the Office product group that includes business applications. Microsoft Excel enables users to arrange, format, and compute data in a spreadsheet.
When organizing data using software such as Excel, Data analysts, analysts, and other users can make data easier to read as data is added and altered. Excel has a lot of cells or boxes which are arranged in columns and rows. The information is stored inside these cells.
Excel is a component in the Microsoft Office and Office 365 suites, and it is compatible with other programs in the Office suite. Excel is available on Windows, macOS, Android, and iOS platforms.
MS EXCEL Uses
Excel is most often used in the business world. It is used for business analysis, human resource management, operations management, and reporting on performance. Excel utilizes a vast array of cells that are formatted to organize and manipulate data, as well as to solve mathematical problems. The spreadsheet allows users to arrange data within the spreadsheet by using pivot tables, graphing tools, and formulas. The spreadsheet program also comes with a macro programming language known as Visual Basic for Applications.
The advantages of using MS Excel
The best way to store data
Even if you do not use one of the options or any of the tools that Excel gives you, it’s the most effective method to save information.
Calculations can be performed
The ability to do calculations can make Excel the best spreadsheet software in the world. Excel has an entire set of functions you can apply to calculations.
Include all the tools for data analysis
The primary reason for having data is understanding and draw insights from it. The good news is that Excel offers one of the most effective tools for analyzing data.
Imagine that you have data comprising thousands of rows. You could create the data into a pivot table the data to make the summary table.
Easy to create data visualizations using charts
In Excel, you can use the option of creating charts and displaying the data you have in a visually appealing way.
The majority of charts you must use to present your data are in place, and you can add them with just a single click.
If you visit the Insert tab, which is located in the chart section, you’ll find all the charts you can add.
You can print reports easily.
Even if you love to preserve trees, there may come a time when you’ll need to print reports that you can share with others or give the information to anyone.
Excel indeed allows printing with many options for personalization, enabling you to change the margin, paper size, and orientation.
What is a data model in Excel?
A data model within Excel is a handy feature that allows users to incorporate data from multiple tables so long as they have one column in common. A data model lets users avoid using the VLOOKUP() feature to make the data organizing process much more manageable. Additionally, it reduces other reporting complications, such as PivotTable objects.
When should you use the data model in Excel?
An Excel user can use the data model to connect several tables and better understand the data these tables can store. It’s beneficial to any table that extends the information in another table. For instance, think of the teacher with two separate data tables. One table has all of the ID numbers of their students as well as information regarding their birthdays as well as gender, age, and the number of absences they’ve experienced during the last semester. On its own, this table is useless for the teacher since the teacher cannot remember the ID numbers of each student.
The teacher has a second table with all the student ID numbers and their names. The teacher would like to merge the information from both tables so that they can be able to identify each student’s name. This is done by creating a data model using both tables.
How to create a data model using Excel through the creation of new tables?
Here’s a guideline for creating a data model in Excel by creating new tables.
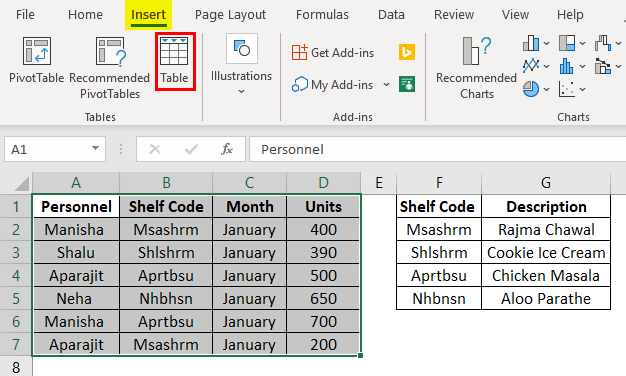
1. Consolidate all your data into tables
First, you must combine your data into tables. Begin by inserting all your data into cells and then giving the column headers a name. Select all cells with details by clicking the leftmost top cell and moving your mouse to the lowest rightmost cell. Select the “Insert” tab within the Excel ribbon, then choose “Table” as the “Table” option. In the dialog box, check that the selected range of cells is correct. If not, click “Cancel” and reselect your cells.
If your selection is correct, ensure you tick the box which says “My table has headers.” Then click “OK” in the bottom right corner of the screen to see your data transform into tables. Select the “Table Design” tab within the Excel ribbon. Look for “Name” in the “Name Box” and change the table’s name instead of “Table1” to something more distinctive. Repeat this procedure for each of your data sets. Be sure to only build a data model for tables with at minimum one column shared.
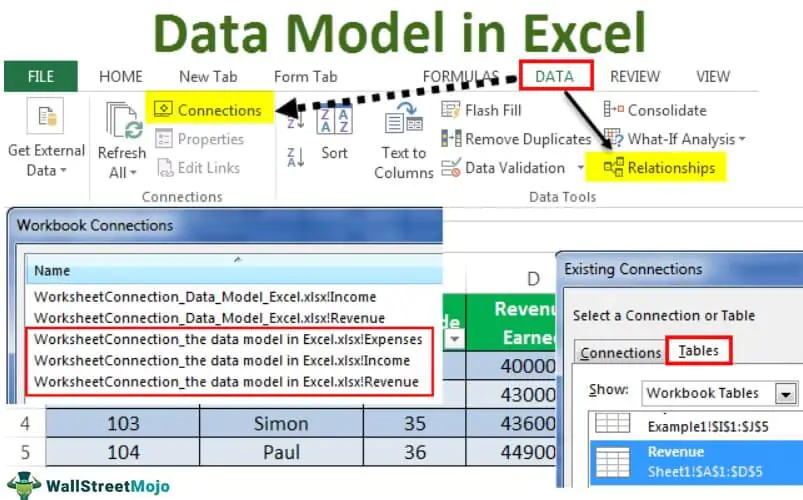
2. Choose “Connections” option within the “Data” tab
Select “Data” tab within your Excel ribbon. This tab is located between the “Formulas” and the “Review” tab. Locate the group that reads “Connections” just to the right of the “Get External Data” group. Click on the icon that says “Connections.”
3. Select the suitable options within the “Workbook Connections” pop-up window
When you click the “Connections” button, the “Workbook Connections” pop-up window opens. Click the “Add” drop-down button in the upper right-hand corner. Select the option “Add to the Data Model.” Switch to the “Tables” tab from “Connections” tab. This allows you to view every table in your workbook.
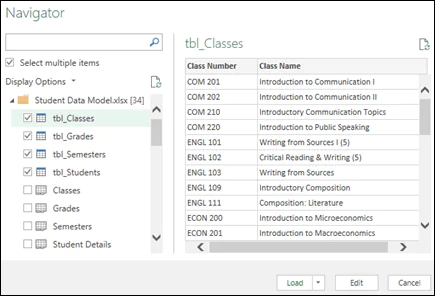
4. Select each table you wish to be able to add to your model of data
Under the “Tables” tab, click on the table you wish to include in the data model. Click “Open.” button in the lower right corner. Confirm that this table appears underneath the text that says “ThisWorkbookDataModel.” Enter the “Add” drop-down menu, select “Add to the Data Model,” choose” Tables, “and select the following table you’d like to include in your data model. Then click the “Open” button. Repeat the process for all relevant tables. When you are done, you can close this “Workbook Connections” dialog box by clicking “Close” button.
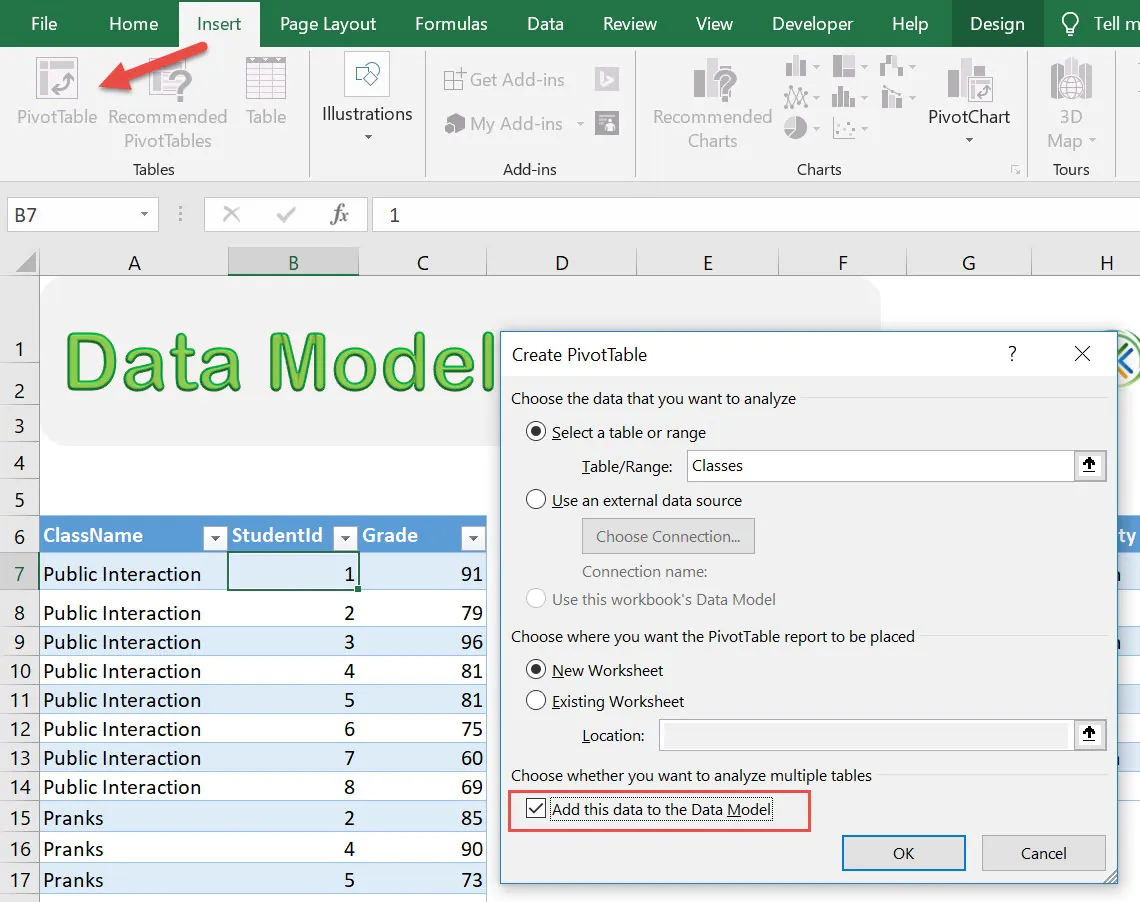
5. Pivot your data
Select the “Insert” tab. Select the “PivotTable” button within the “Tables” group. Choose the option “Use an external data source” and click “Choose Connection.” Navigate to the “Tables” tab and select the option that reads “This Workbook Data Model.” Click “Open.” Choose the option of putting your Pivot Table on an entirely new worksheet. Select “OK.”
6. Create connections in your model of data
Go to the “Analyze” tab within the Excel ribbon. Select “Relationships” button. In the “Manage Relationships” dialog box, click “New”. Select the columns and tables you would like to incorporate into your relation. Select “OK.” Create as many relationships as you want. Please take note of the fact that Excel automatically corrects primary and foreign columns if an individual chooses to use them in the wrong way.
How do you make a data model in Excel by using multiple tables to import at the same time?
If you have tables that are already in use from websites, text files, Microsoft Access or another source, you may need to import the tables. Here’s a step-by-step guide to building an Excel data model by the import of multiple tables at one time:
Select the “Data” tab.
Find in the “Get External Data” group.
Select the “From Access” option to open the “Select Data Source” pop-up window.
Browse through your data to choose any database you have on your computer.
Select the box which says “Enable selection of multiple tables.”
Select one or two tables from your database.
Hit the “OK” button in the lower right-hand part of the window. This will bring up “Import Data” dialog box.
Select the option labeled “PivotTable Report,” which is the option that imports your selected table into Excel and then creates the PivotTable.
Click “OK” in the bottom right corner to let Excel automatically generate a model of data.
Final words
MS Excel is a commonly utilized Microsoft Office application. This Excel spreadsheet application allows you to save and analyze numbers. In this article, we will learn how to build a model of data in MS Excel.
The Data Model feature of Excel is designed to aid users in collating data scattered across many data tables. In data models, multiple tables can be transformed into one by relying on one or more columns that are common to all. Utilizing Data modeling, you can combine data from several tables or other sources on this platform.