How to create data table in MS Excel?
Microsoft Excel is a computer application that lets users organize, record, and analyze information in a spreadsheet. Almost all businesses and data entry services use this software. In the Excel program, it is possible to display your data in various formats. When you’re working with Excel and want to arrange your data in a unified way, you can learn how to create a data table within Excel. This article will explain the purpose of a data table in Excel, why you may need to create one, and how you can create one in just four steps.
What is MS EXCEL?
Microsoft Excel is a spreadsheet program that is part of Microsoft Office. Spreadsheets contain data in rows and columns, which can be altered mathematically with the help of primary and advanced mathematical operations. In addition to the basic spreadsheet features, Excel offers programming support with Microsoft’s Visual Basic for Applications (VBA) and the ability to pull information from other sources using Microsoft’s Dynamic Data Exchange (DDE). Microsoft Excel is an Electronic Spreadsheet Computer Program.
The benefits of using MS Excel
1. MS Excel features the Microsoft Office Fluent user interface. It will assist you in finding the right tools when you need them.
You can find the tools you’ll need using the results-oriented Office Fluent user interface. Based on the job you’ll be required to complete, whether creating tables or formulas to write, the latest versions will provide the proper commands when you need these.
2. Integrate, organize and examine huge data sets in spreadsheets.
Excel allows you to work with huge volumes of information. Excel spreadsheets can hold more than 1 million rows or 16,000 columns. Multicore processor platforms may combine alongside the more comprehensive Excel spreadsheet Excel to speed up calculations of spreadsheets with formulas.
3. Use the newly designed charting engine to present your research in professionally-designed charts.
Create stunning charts in just a few clicks using the tools available within Microsoft’s Office Fluent user interface. You can add visual enhancements to your charts, such as 3D effects, soft shadowing, and transparency. Make and use charts the same way, regardless of what program you’re using, as the charting engine works with Microsoft Office Word and Microsoft Office PowerPoint.
4. You will get better and stronger assistance when working with tables.
Format and create Expand filter and create tables in formulas, as the tables’ capabilities have been substantially improved. When you view data in Tables, Excel keeps table headings in view as you scroll.
5. Create and use PivotTable interactive views easily.
PivotTable views enable you to reorient your data to help you answer multiple questions quickly. Please find the answers you’re searching for faster, and then develop and use PivotTable views more effectively by simply dragging fields into places you want them to appear.
6. “See” significant trends and identify patterns within your information.
Use conditional formatting to make your data faster and identify patterns in your data. The latest designs include color gradient data bars with heat map colors, color gradients, and icons to indicate performance.
7. Use Microsoft Excel on your desktop and online to share spreadsheets more safely with other users.
With Excel 365 online, you can share spreadsheets with your friends to allow them to access the spreadsheet using the internet using a browser. Users can view the input parameters and interact with data through their browsers on the internet and have access to the same spreadsheet, making sure the changes that anyone makes are available to all.
What exactly is a data table?
A data table in Microsoft Excel is a format that can be used to show your data. It differs from the conventional Excel format, that is, the arrangement of cells that appear in the spreadsheet. You can build an Excel data table by putting your data into Excel. You can add your data to the Excel sheet as a range form then convert it into a table. Alternatively, you could convert blank cells into table format and count data. This is an excellent method of improving the efficiency of your spreadsheet’s data.
What is the reason for creating a data table in Excel?
Excel provides specific functions to those who arrange data using a table instead of the standard range format. Here are some advantages:
Visible table headers: When you create tables, the head within a column will move along the page while scrolling through the page, which lets you know the column you’re editing, regardless of how much in the pages you’re working.
Design that is easy to read: Excel tables automatically include colored shadings to each row that is not in use, making the table more readable. You can also alter the design elements of your table.
It is easy to add data. It is easy to add any new information to data tables by entering it into an adjacent empty cell or dragging the corner to which direction you want to extend.
Options for data analysis: The table format makes it simple to add automated data analysis options such as the totals of rows, scores, minimums, counts, maxes, and sums.
Sort functionality: The table format lets you arrange your information by clicking the downward arrow beside the header and selecting your preferred sorting options. You can sort by color, or from Z to A, or by color.
Filter feature: You can also apply filters to a data column to modify the types of cells the program adds to the table.
How to create a data table in Excel?
Follow these steps to make a data table in Excel.
1. Select the cells you’d prefer to convert
Then, open Excel and input the data you want to add to the table. Enter the data in well-organized columns and rows. Inputting your data before creating a table will aid in automatically populating your table with the information you’d prefer to have. If you’d like to make a blank table and input the data later, you can choose the blank cells you want to include.
Once you’re all set, you can select the cells you want to add to your table. To select them:
Click the cell in the lower left of the range.
Hold the mouse and drag it across the screen until it reaches the cell in your selection’s lower right area.
Release the mouse.
It is possible to identify the cells you’ve chosen by the green border at the edges.
2. Open the Create Table window
After you have selected the cells, you want to use, click your “Insert” tab at the top of the page. Next, select “Tables,” located on the left side of the menu. It will open a drop-down menu that includes the options “Pivot Table,” “Recommend Pivot Tables,” and “Table.” If you’re looking to build an elaborate table, then you can choose a pivot table or examine the recommendations for pivot tables. For more information on this table type, you can use your mouse to learn more.
To create a conventional data table, choose “Table” on the. This will open the Create Table pop-up window.
3. Customize parameters and create your table
It is important to note that the Create Table window includes the inquiry, “Where is the data for your table?” Below the question is a box that contains the values that are similar to the cells that you’ve previously chosen according to the format:
$[Letter]$[Number]:$[Letter]$[Number]
In which the numbers and letters are used to identify each cell. For instance, if you chose the cells between E16 and D16 to make your table, the box might appear to read “$D$16:$E$19”. You may edit the cells at this point by changing the numbers and the letters inside the box. It is also possible to input a different range by hand.
When you click the Create Table window, it will ask for your permission to edit headers. Create Table tab also has the option to check the box that reads, “My table has headers.” If you do not check the box, Excel automatically creates headers for your table that you can modify following creating the table. If you select the box, you’ll be able to skip these automatic headers. This could be a good option if you already have headings within your selection or if you’d rather have a table with no titles. After customizing your settings, click “OK” to create your table.
4. Edit when needed
Once you’ve set up your table, you can modify the row and column titles or alter the values in the table. To edit this, select the cell you wish to edit, and then double-click to open the editing option. You can also alter how big your table is after you’ve created it by clicking the small blue arrow at the lower right corner, then moving it to the direction you’d like it to expand. This adds columns or rows to the table according to instructions.
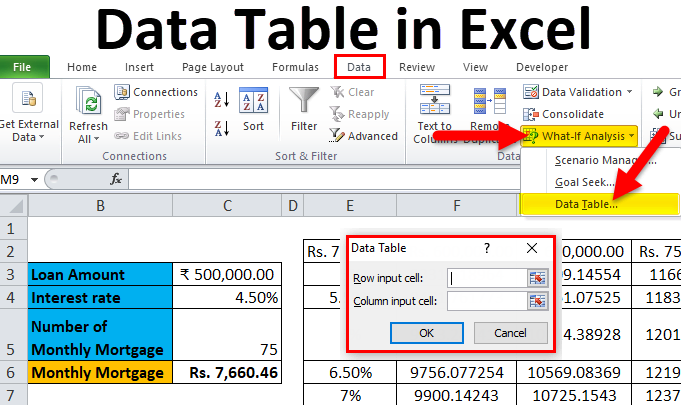
Conclusion
When using Excel, data table can be described as a set of cells demonstrating how changing one or two variables within your formulas can affect the outcomes. Excel data tables can be used to conduct What-if Analysis on a given data set. With the help of table data, you can study the effects on your output by altering the input values in the formula.