All you need to know about data Analysis in MS Excel
Data Analysis is vital since it aids businesses in understanding their customers better, boosts sales, enhances targeting of customers, decreases costs, and facilitates the development of more effective strategies for solving problems. Businesses and data entry services typically employ MS Excel to analyze data. Spreadsheets are more cooperative than other software. It’s simple to analyze and manipulate information in spreadsheets. Plus, it is possible to integrate spreadsheets into specific software. Spreadsheets are easy and quick to incorporate into workflows.
This article will discuss how to use data analysis within MS EXCEL.
What Is Data Analysis?
While many organizations, groups, and experts have their methods of approaching data analysis, the majority can be reduced to an all-encompassing definition. Analyzing data is the procedure of cleaning, altering, and processing data and extracting actionable pertinent information that can help businesses make better decisions. This process helps to reduce the risk of making decisions by providing valuable information and statistics that are often illustrated in charts, pictures, graphs, tables, and charts.
A simple instance of data analysis could be observed when we make decisions in our everyday lives by looking at past events or what is likely to occur if we make that decision. In essence, it is the process of looking at the future or past and deciding based on the analysis.
What is MS EXCEL?
Microsoft Excel is a spreadsheet application part of the Microsoft Office Package. MS Excel creates Worksheets (spreadsheets) to save and arrange information in a table format.
Microsoft Excel is one of the most frequently used software applications across the globe. Excel includes an array of Powerful Tools and Functions, employing it in many applications in the world’s IT Companies. It is simple to enter the data, as well as read and alter the data. Excel records information in table form with rows and Columns.
How is Excel useful to do?
Microsoft Excel is used for keeping the data in place as well as processing the data in a way that allows for the analysis and presenting the data.
Data can be entered into Dates, Strings, or Strings types of data into Excel cells and saved in the files for future use.
We have a variety of formulas to calculate in Excel.
We can Develop Tools and Dashboards in Excel.
We can interact with other Applications using Excel.
Excel has connections to a wide range of Data Bases.
Data can be represented in charts.
We can drill down and analyze the data by using Pivot Tables in Excel.
Data Analysis in Excel
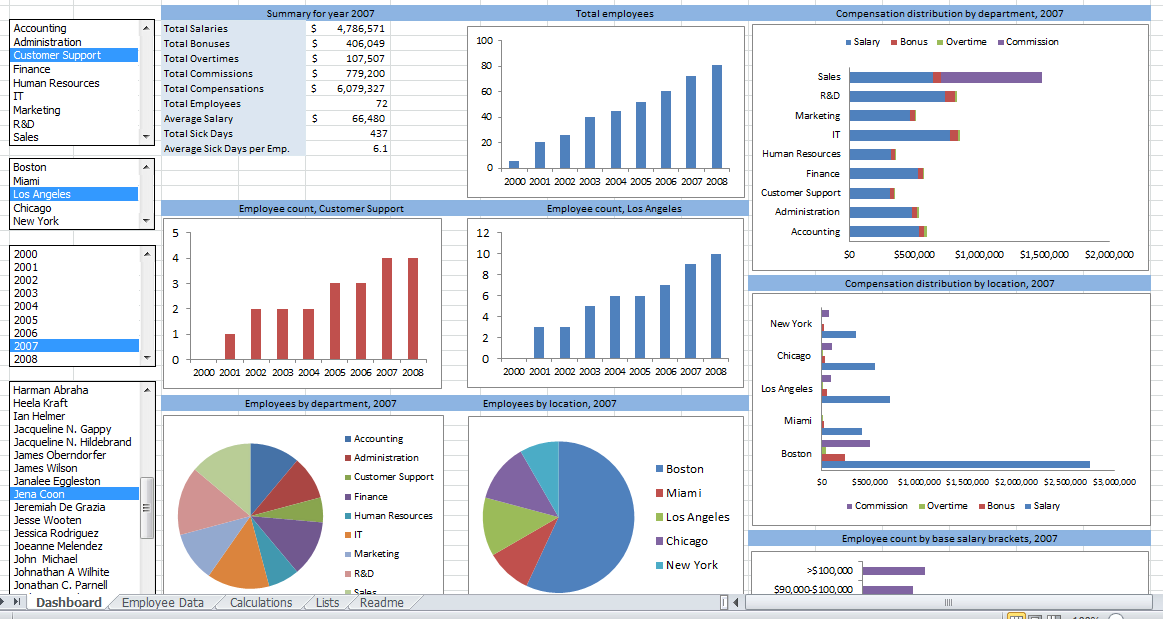
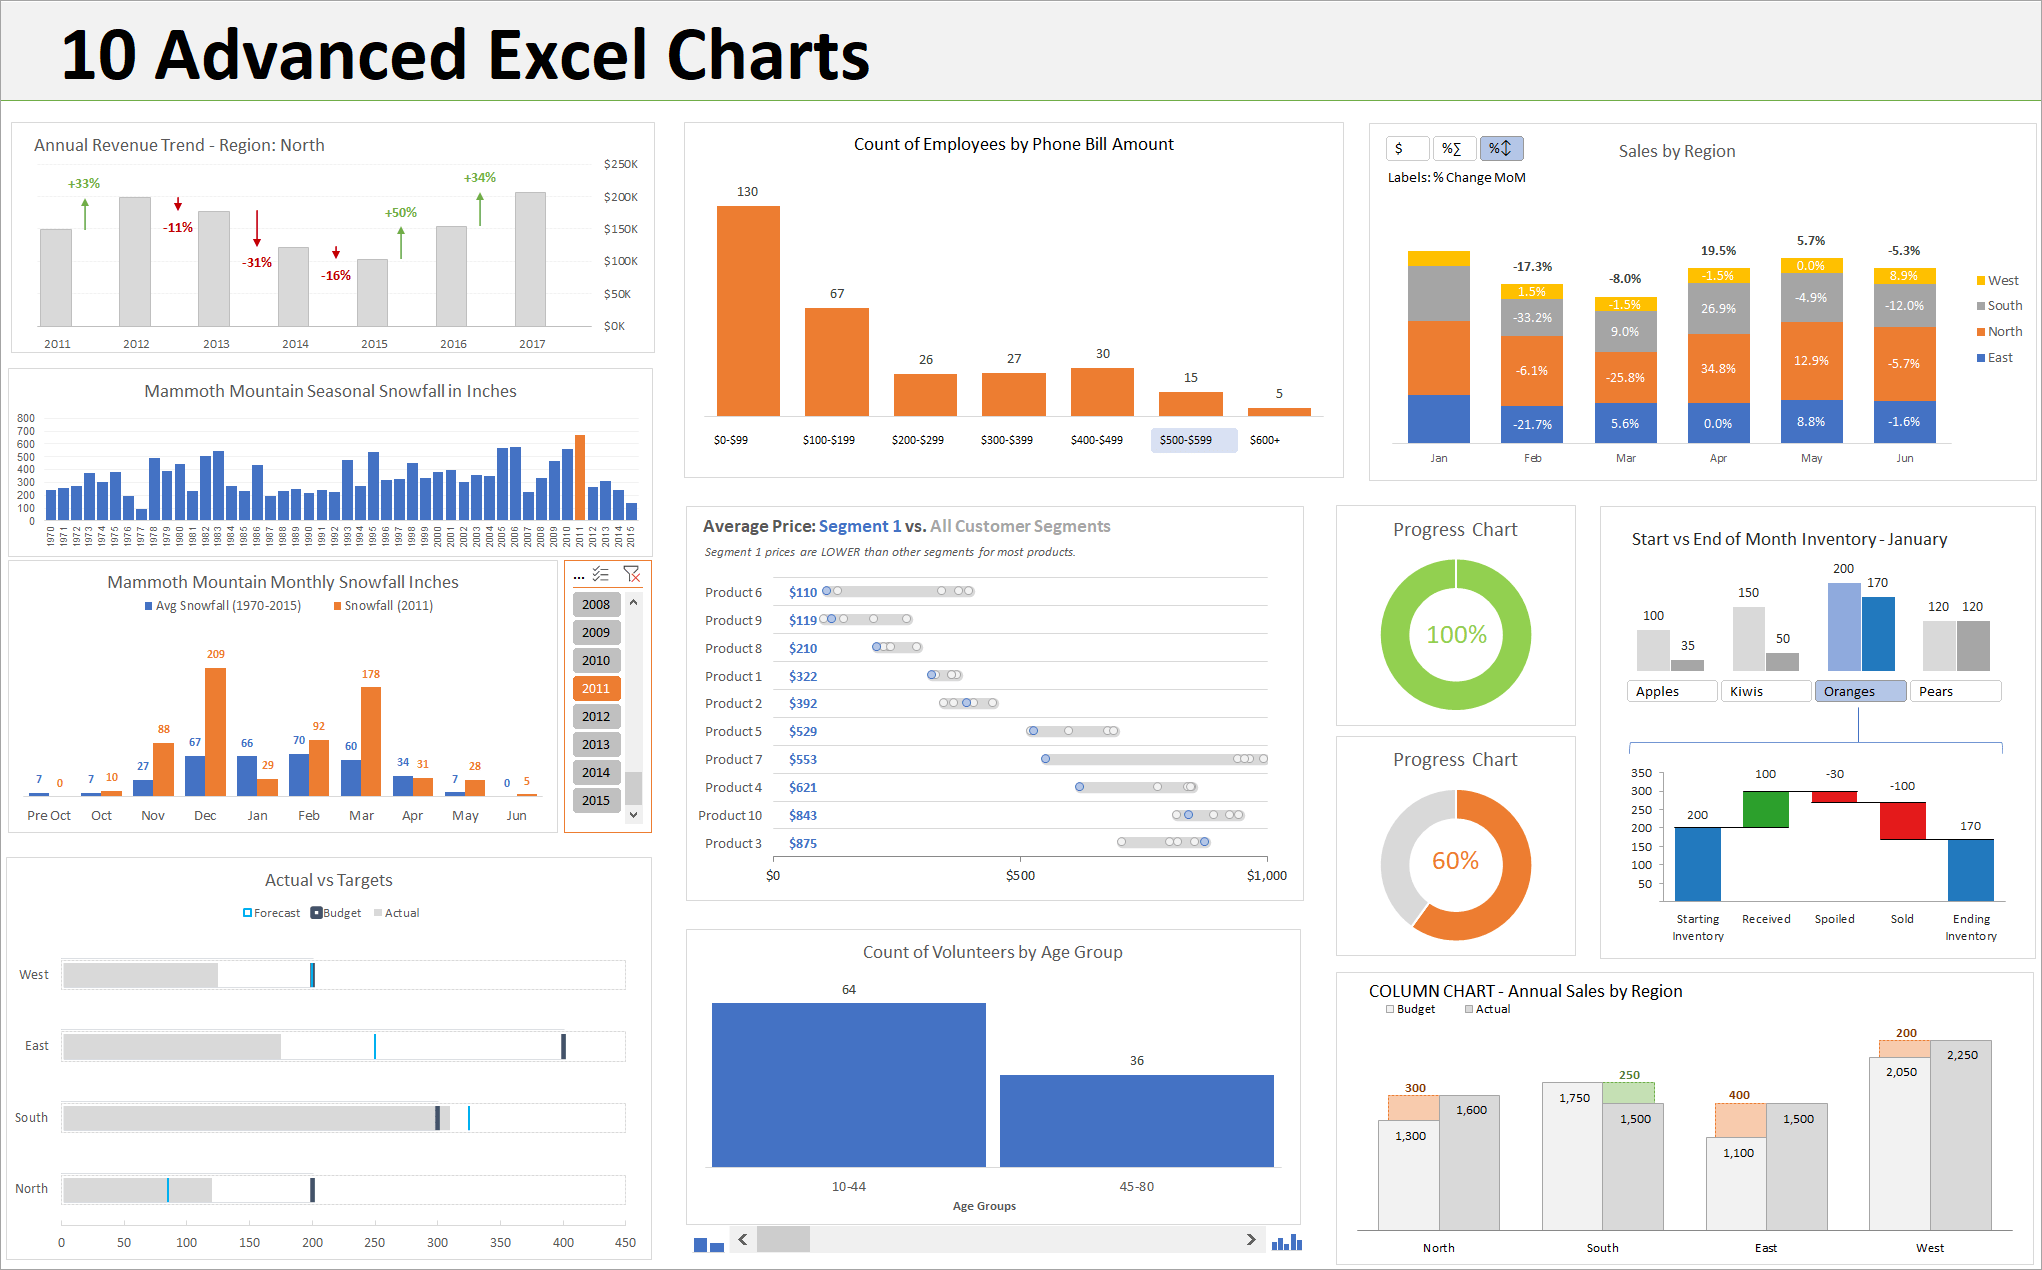
Charts
Another method of presenting an argument using graphics is using charts. They simplify data so that data sets are simpler to understand and analyze. Excel is famous for its ability to arrange and calculate numbers. Charts are a graphical representation of any collection of data. Charts are a visual representation of data that utilizes symbols like bars in the Bar Chart or lines in the Line Chart to represent the information. Excel provides a range of chart types from which you can choose, or you can use Excel’s Excel recommended Charts option to look at charts that are tailored to your needs and pick one of them.
Excel charts are excellent for assisting in data analysis by directing attention to one or a couple of elements of a report. You can use Excel charts to eliminate unnecessary “noise” from the story we’re trying to communicate and concentrate on the most significant information elements. When you enter the tab Insert and then choose the Charts command group, you can easily create lines, pie, or column charts. The procedure for creating these charts is simple.
Step 1: Select the data range.
Step 2: Click Insert > (choose the type of chart you want from the icons).
Step 3: If necessary, Modify the chart you have inserted.
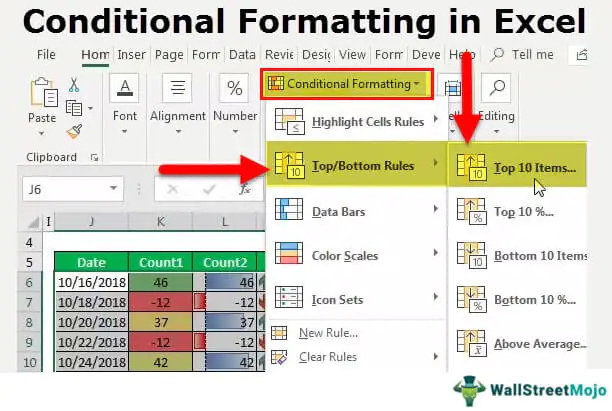
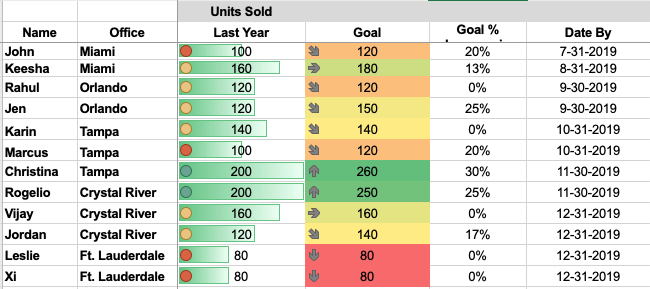
Conditional Formatting
Conditional formatting can aid in highlighting trends and patterns within your information. Set up rules to define the appearance of the cells by their value to make use of it. Conditional formatting can use a selection of cells (an option and a named range), the Excel table, or even an Excel PivotTable report using Excel on Windows. Follow the steps below to perform the conditional formatting.
Step 1: Click on Conditional Formatting under the tab Home. Do any of these:
If you want to alter the value of a cell, change the values in individual cells, and do it. Choose Highlight Cells Rules or Top/Bottom Rules, and select the one that matches your requirements. If you want to highlight dates that occurred after this week or numbers between 100 and 50 or the lowest 10 percent of scores, choose Highlight Cells Rules.
A color scale that shows the degree to which a cell’s color is correlated to its position in the upper or lower regions of the range. This emphasizes the relation between values within the cell range. Distributions of sales between regions are an instance. Click on Color Scales and click on the desired scale.
To emphasize the relationship between values within a range of cells, you can point at Data Bars and then click the desired fill. This creates a color band around the cell. Comparisons of population or price in cities of significant importance are two instances.
To highlight a range of cells that contains between three and five sets of numbers, each having its threshold, go to Icon Sets and click on a set. For example, you can use an assortment of three icons to highlight those cells that have sales under $80,000 or $60,000 and $40,000. You can also use a five-point scoring system for autos and employ a set of five icons.
Methods for Data Analysis in Excel
Concatenate
=CONCATENATE among the simplest yet powerful formulas for data analysis. Dates, text, numbers, and other data in multiple cells can be folded to create one. This is an excellent method of creating API endpoints, product SKUs, and Java queries.
Formula:
=CONCATENATE(SELECT CELLS YOU Would Like to Merge)
Len
=LEN will quickly return the total number of characters within any given cell. In the above example, the formula =LEN could be employed to determine the number of characters within cells to distinguish between two stock-keeping unit (SKUs) types. LEN is crucial when differentiating between unique identifiers (UIDs), which can be lengthy and not in the proper sequence.
Formula:
=LEN(SELECT CELL)
TRIM
Apart from one space between sentences, this incredible function can eliminate any areas in cells. This feature is typically used to eliminate spaces that trail. This is usually when text is copied from a different source or when the user enters gaps after the text.
Formula:
=TRIM(piece in text)
COUNTA
COUNTA decides if an empty cell exists. Every day, you’ll come across incomplete data sets as an analyst of data. COUNTA can help you look into any data gaps without altering them.
Formula:
=COUNTA(SELECT CELL)
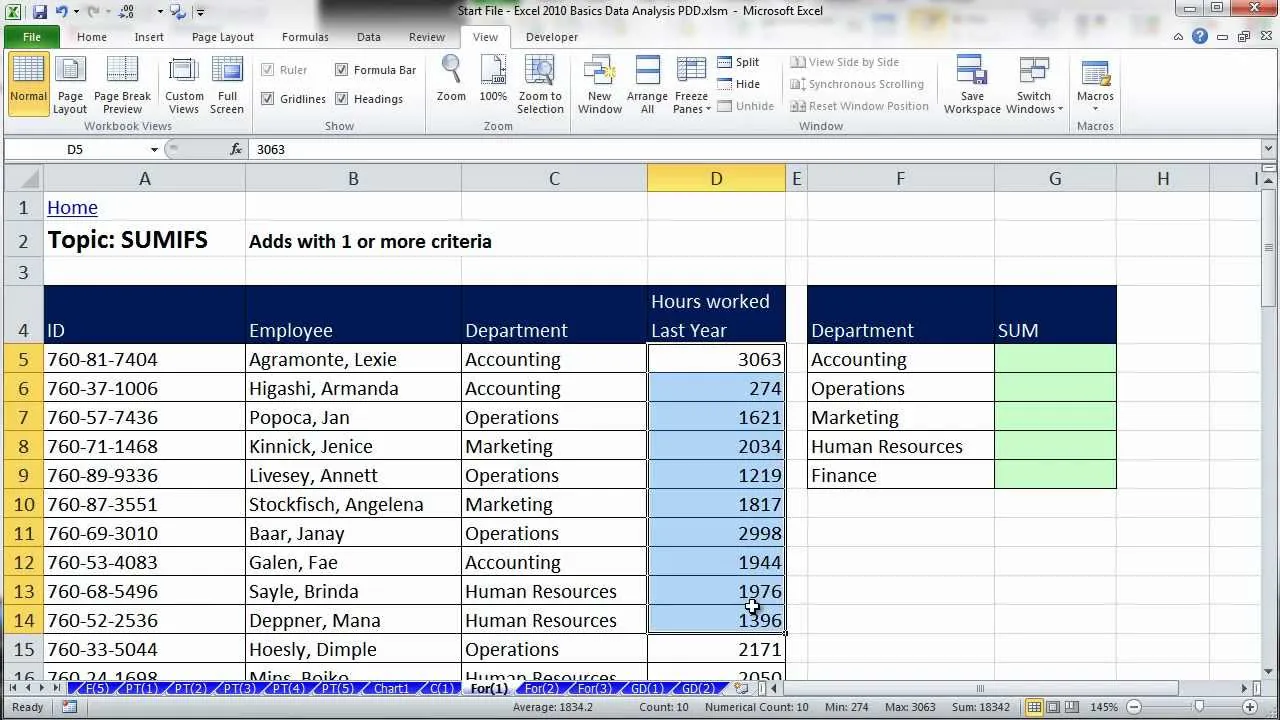
AVERAGEIFS
AVERAGEIFS is similar to SUMIFS and lets you take an average of one or more parameters.
Formula:
=AVERAGEIF(SELECT CELL, CRITERIA, AVERAGE RANGE)
FIND/SEARCH
Search and Find are effective ways of searching for specific text in the data source. Both are listed here because the search engine returns a match that is case sensitive, i.e., If you search on behalf of “Big,” you will only receive Big=true results. A search to find “Big” will, however, be able to match Big or big, broadening the search. This is extremely helpful in the search for anomalies or unique identifiers.
Formula:
=FIND(TEXT,WITHIN TEXT,[START NUMBER]) Alternatively, =SEARCH(TEXT,WITHIN TEXT,[START NUMBER])
Types of data analysis with Microsoft Excel
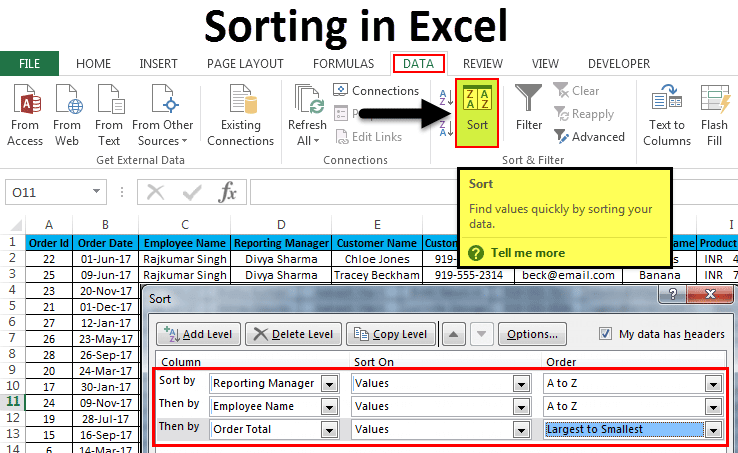
Sorting
When sorting data within spreadsheets, you could change the order of the data to find the values quickly. Sorting a table, range, or data based on some or all columns is feasible. It is possible to classify employees first by department, then by the name of the last.
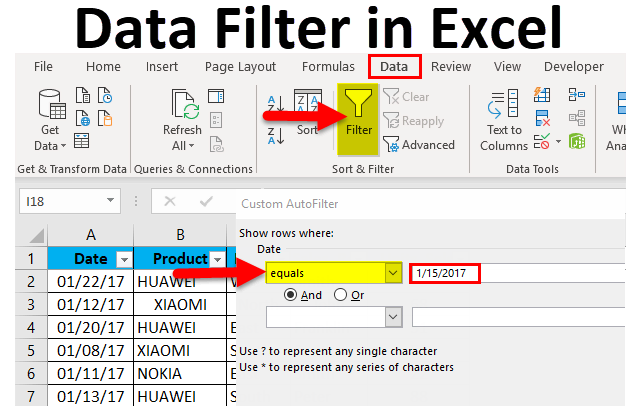
Filter
You can use the feature FILTER to sort data based on your set parameters.
Conditional Formatting
Conditional formatting within Excel lets you highlight cells using a specific color based on the cells’ value.
Charts
A straightforward Excel graph can provide more details than a page of numbers. Creating charts is pretty straightforward.
Conclusion
Data analysis is examining, cleansing, changing, modeling, and transforming data to obtain relevant information, make conclusions, and aid decision-making. Data analysis comes in a variety of forms and techniques, which encompass a range of techniques with a variety of names. It can be utilized in various sciences, business, and social science areas. In the modern business world, data analysis plays an integral part in making more scientifically based decisions and helps companies run more efficiently.
Excel is a great option when searching for an instrument to analyze and display your data. It’s part of people’s daily lives and is utilized by people and data entry services for small and medium-sized businesses, financial institutions, corporations, and government agencies. There are many reasons why Excel is so well-known for its user-friendliness as well as its versatility for data analysis, and also the fact that it’s robust yet cost-effective.
Analyzing data within Excel lets you understand your data using natural language queries, which allow you to ask questions about your data without writing complex formulas. Additionally, Analyze Data provides high-level visual summaries, trends, and patterns.