How to use the process monitor on Windows 11?
Many businesses and data entry services using process monitoring for various reasons. Process monitoring helps set up all sorts of filters that make it easier for you to make changes and search. You can also see the percentage of ongoing processes on a live basis. Process monitoring allows us to stop any processes that are not possible to terminate using the windows administrator. You can also qualify for launching an application recognized by Windows through the program’s interface.
Process monitor expands on the options in the Windows version. This program can be used to monitor all active processes in the system. This post will demonstrate how to use the process monitor on Windows 11.
Installation and use of process monitor
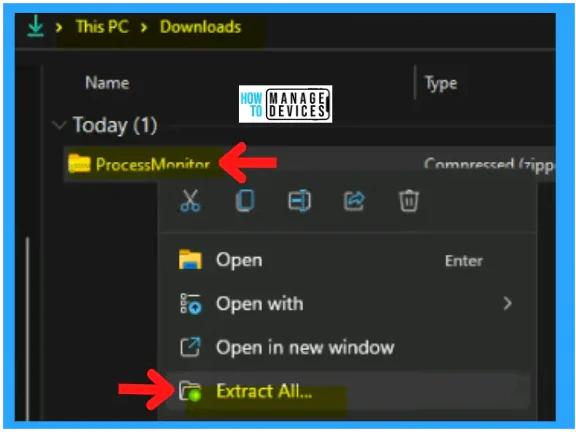
Step 1: You can download the process monitor via the Microsoft website. The process monitor immediately starts downloading and saves it as a zip file in the download folder. Go to the download folder on your system and right-click it. Select Extract all.
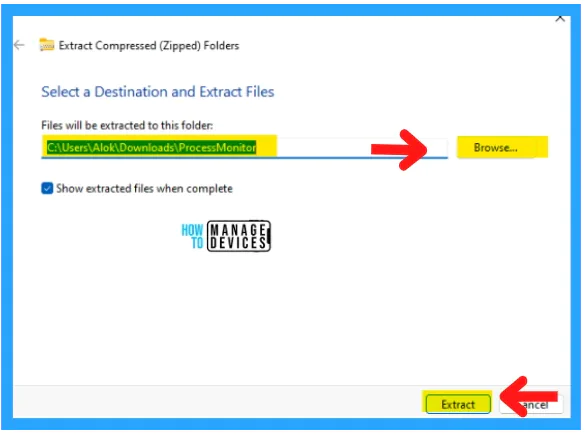
Step 2: Click on Extract All to proceed. It will ask you to choose a destination folder from which to extract the folder. All downloaded files are saved to the Download Folder by default.
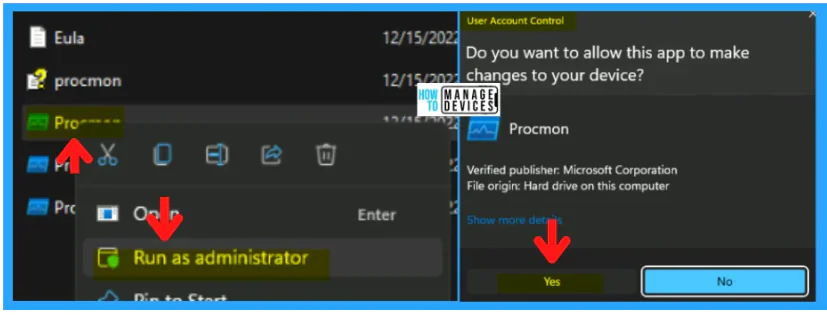
Step 3 From the extracted folder, choose Procmon and right-click to select Run as administrator. To continue, click Yes.
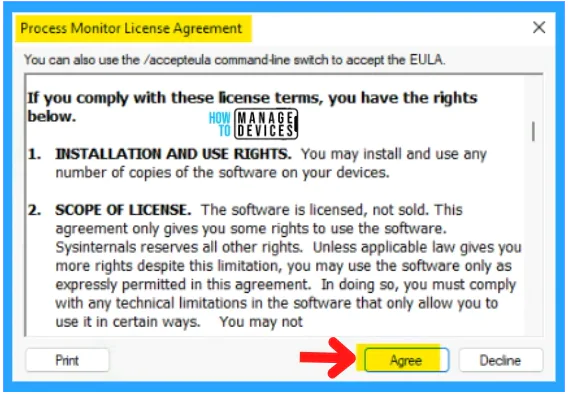
Step 4: The following window displays the Process Monitor License Agreement. Click on it to agree to its terms and conditions. The installation will now begin.
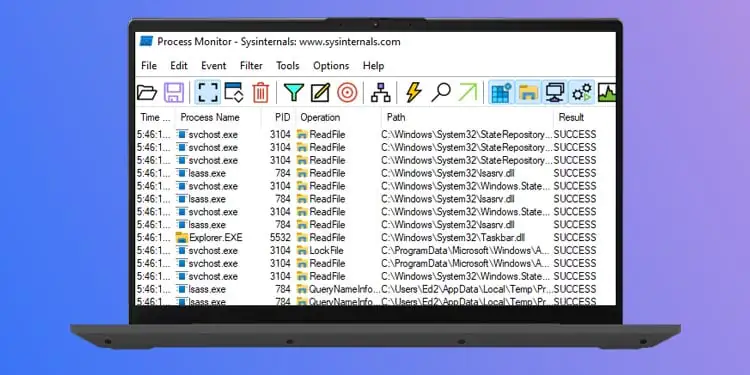
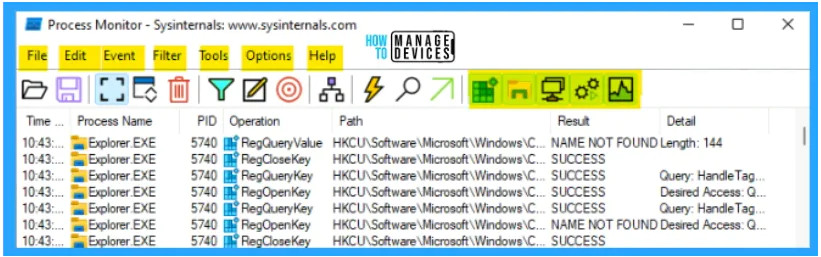
Final Step: The last step refers to the application interface, as shown in the figure below. The interface of the process monitor can be viewed below. You can see the interface of the process monitor application.
File Tab
Edit Tab
Event Tab
Filter tab
Tools Tab
Options Tab
Helps Tab
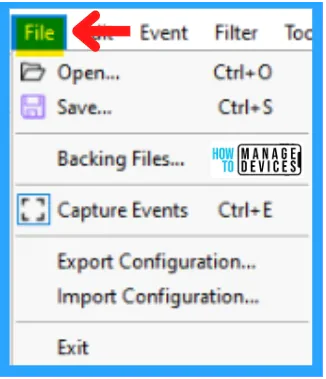
1 File Tab
You can make some changes to the process by using the file tab. These are some alternatives to save, open, and back files.
Open: To open a file or process
Save: To save the process
Backup Files: To create a backup storage
Capture Events: To save all process paths in the record
Export Configuration: To export specific processes
Import Configuration: To import your design into it
Exit: Leave the process monitoring window
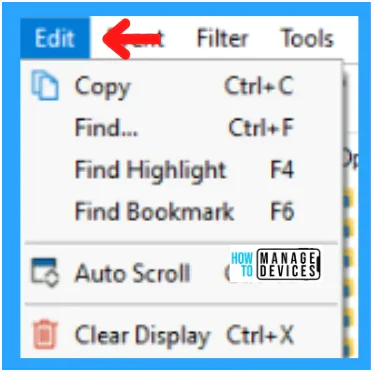
2 Edit Tab
The Edit tab allows you to make modifications to the currently running process. To make modifications, there is an option.
Copy: To copy a process
Find: To find a specific process
Find Highlight: To view highlighted processes
Find Bookmark: To find bookmarks during the process
Auto Scroll: To scroll through the process window automatically
Clear Display: To close the process, the monitor window
3 Event Tab
The Event tab allows you to view any event properties and highlight events. It also manages details about the processes.
Properties: Show the detailed information
Stack: Show the stacking information
Toggle Bookmark: Toggle between the bookmarks
Jump to: This tool allows you to jump from one step to the next.
Search Online: Search online event
Include: To include process details
Exclude: To exclude process details
Highlight – Shows highlighted details
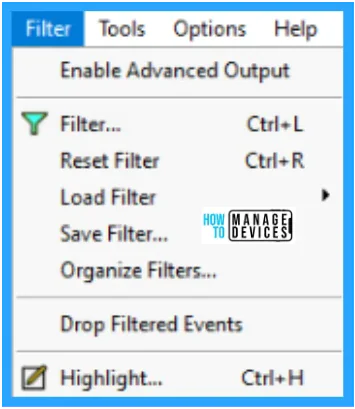
4 Filter Tab
The filter tab allows the user to search for a particular process and monitor it. The filter tab allows you to create filters for search, reset filters and load filters. These details are displayed below:
Enable Advanced output: This allows for advanced output
Filter – To create filters during the monitoring process
Reset Filter: To reset your filters
Load filter: To use the filters
Save Filter: To save a specific set of filters
Organize Filter: To organize filters
Drop Filtered Event: To drop some of the filtered events
Highlight – Highlighted the filter selections
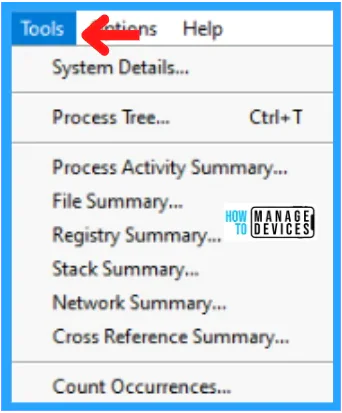
5 Tools Tab
The Process Monitor has a tab that allows you to make changes, review the summaries, and more. Below are the details:
System Details: Displaying details about the system
Process Tree: Displaying the process tree for an event
Process Activity Summary: These summaries only represent Process Activity
Registry Summary: Showing the outline of the registry process
Stack Summary: Represents the stack details
Network Summary – Shows details about the network
Cross-Reference Summary: Paths written and read in between different processes
Count occurrences: Count values occurrences
6 Option Tab
The options tab allows you to change the interface, such as the Font and theme. You can also modify the highlight colors, colors, etc. Below are the details:
Always on Top: The top events
Font : Modify font styles
Highlight Colors: Highlight colors choosing
Theme: Modify the theme
Configure symbols: The symbol configuration for the application
Select Columns: Select specific columns.
History Depth: Limits the number of events in a run.
Profiling Events: Can be used to generate thread profiling events which capture the state all threads are running at regular intervals.
Enable Boot logging: This will generate thread profiling events which capture the state and execution of all threads at regular intervals.
Show Resolved Internet Addresses: It displays the resolved network address.
Hex File offsets and lengths: Displays the file offsets as well as the lengths below
Hex Process & Threads IDs: Shows the process & threads IDs.
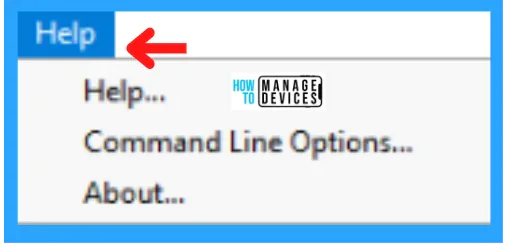
7 Helps Tab
The help tab, like other applications, is available for users to resolve any problems regarding their PC’s health. It contains the process monitor, index, search contents, and the ability to close it.
Help: Displays all contents, searches, and indexes
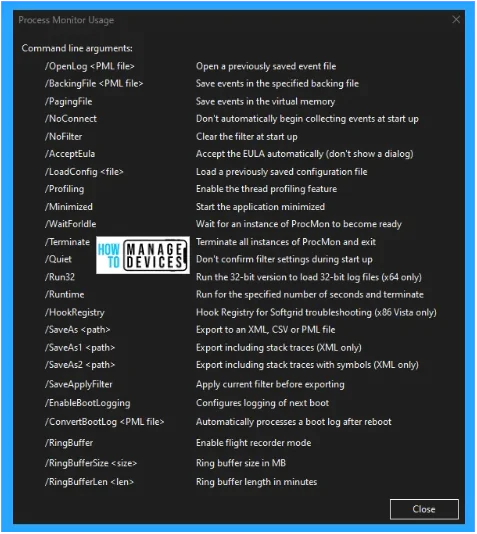
Command-Line Options: This shows details about the command-line arguments
About: Provides information on process monitor
How to use Process Monitoring in Windows 11?
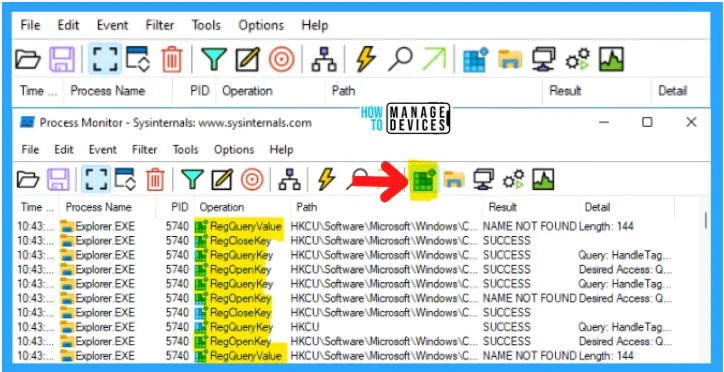
Register Activity
The Registry Activities tab displays the current running process for the device. In the figure below, an arrow indicates that the registry activity is being performed.
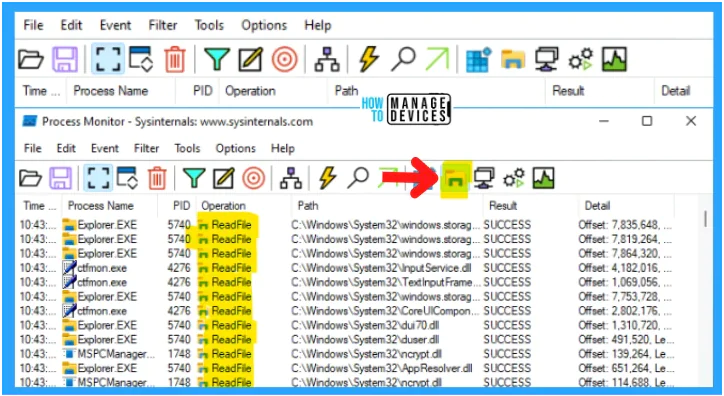
Show File System Activity
The Registry Activities tab displays the current running process for the device. In the figure below, an arrow indicates that the registry activity is being performed.
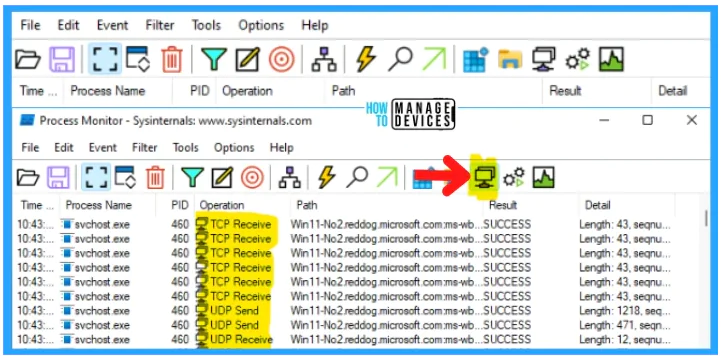
Show Network Activity
The Network Activities displays the currently running process. In the figure below, an arrow indicates that there is a Network activity.
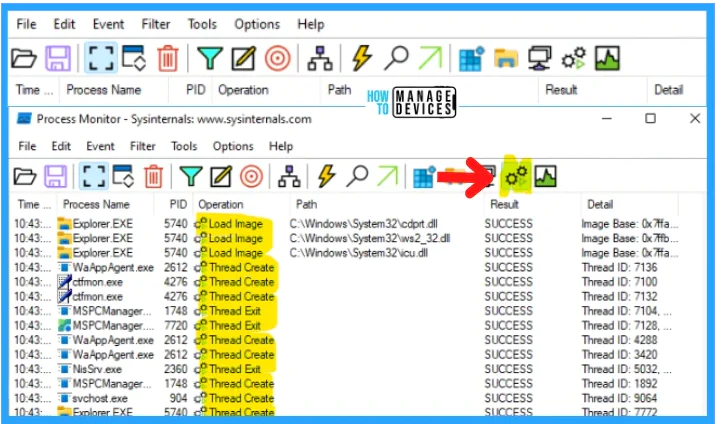
Show Process and Thread Activity
The Process and Thread Activities are displayed to show the currently running process. In the figure below, Process & Thread is marked with an arrow.
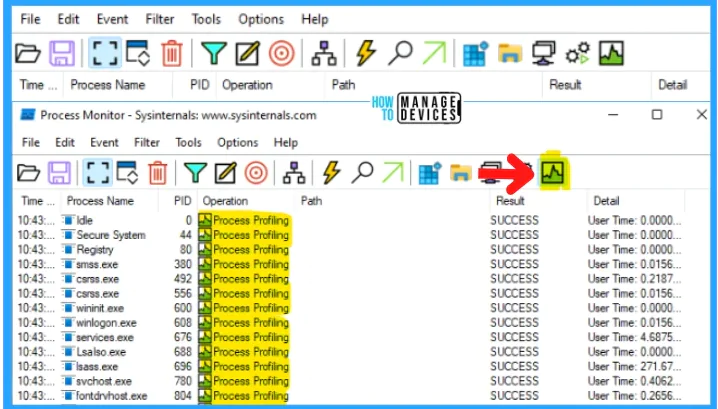
Show Profiling Events
The Profiling Activity displays the currently running process. In the figure below, you can see that the Profiling activity has an arrow.
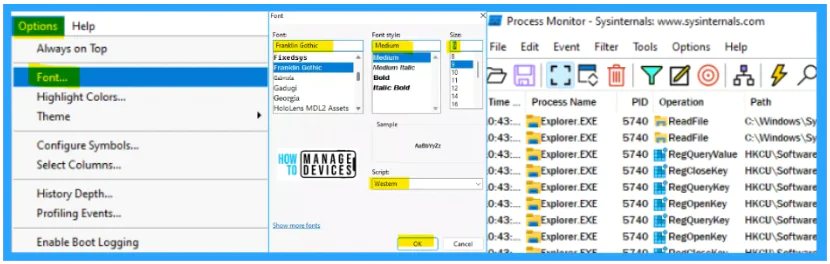
The Options tab can be used to change the Font of an application. Below is a step-by-step guide to change the Font of your application.
Click on the Options Tab
Click on Font
Select Font in the Font window
Choose Font Style
Choose Font Size
Click on OK
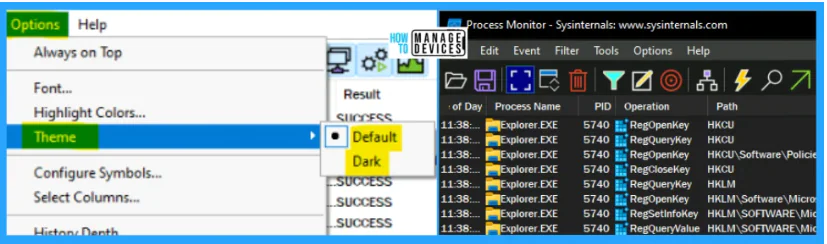
You can also modify the theme of the application. To change the theme to dark, click on Dark. After restarting the system, the Process Monitor window will change to dark mode.
Open Options Tab
Get the Theme
Select Dark
Click OK to restart your device
What Are the Capabilities of Process Monitoring?
Process Monitoring offers robust monitoring, filtering capabilities, and other functions, as listed below.
Additional data collected for operation input and output parameters.
Non-destructive filters enable you to set filters without losing any data.
It is possible to determine the root cause of many operations by capturing thread stacks for each operation.
Capture process details reliably. This includes the image path and command line. User and session ID.
Configurable and Moveable columns to any event property.
Filters can be used for any field of data, even fields that are not columns.
Advanced logging architecture can scale to millions of captured events and gigabytes worth of log data.
The process tree tool displays the relationship between all processes that are referenced in a trace.
All data in native log format can be loaded into another Process Monitor instance.
For easy viewing of process images information, use the Process tooltip.
The detail tooltip gives quick access to formatting data that doesn’t fit in the column.
Cancellable search.
Log all operations.
Final Words
Process Monitor is an advanced Windows monitoring tool that displays real-time file system and registry/thread activity. It combines two legacy Sysinternals utilities, Filmon and Regmon.
It provides a wide range of enhancements, including rich and non-destructive filtering and comprehensive event properties like session IDs and user names, reliable process information and full thread stacks with integrated symbols support for each operation, simultaneous log to a file and many more. Its powerful features make Process Monitor a core utility within your troubleshooting and malware-hunting toolkit.