Transform Your Brokerage with Data-Driven Insights
There’s no shortage of data when it comes to brokerage operations. The problem is knowing what to do with it all, and how to tap into info in a way that’s elucidating rather than merely overwhelming.
Thankfully there are plenty of options for deriving insights that inform key decisions, whether big picture or moment-to-moment. Here are some key examples to pique your interest.
Adopting Advanced Financial Charting Techniques
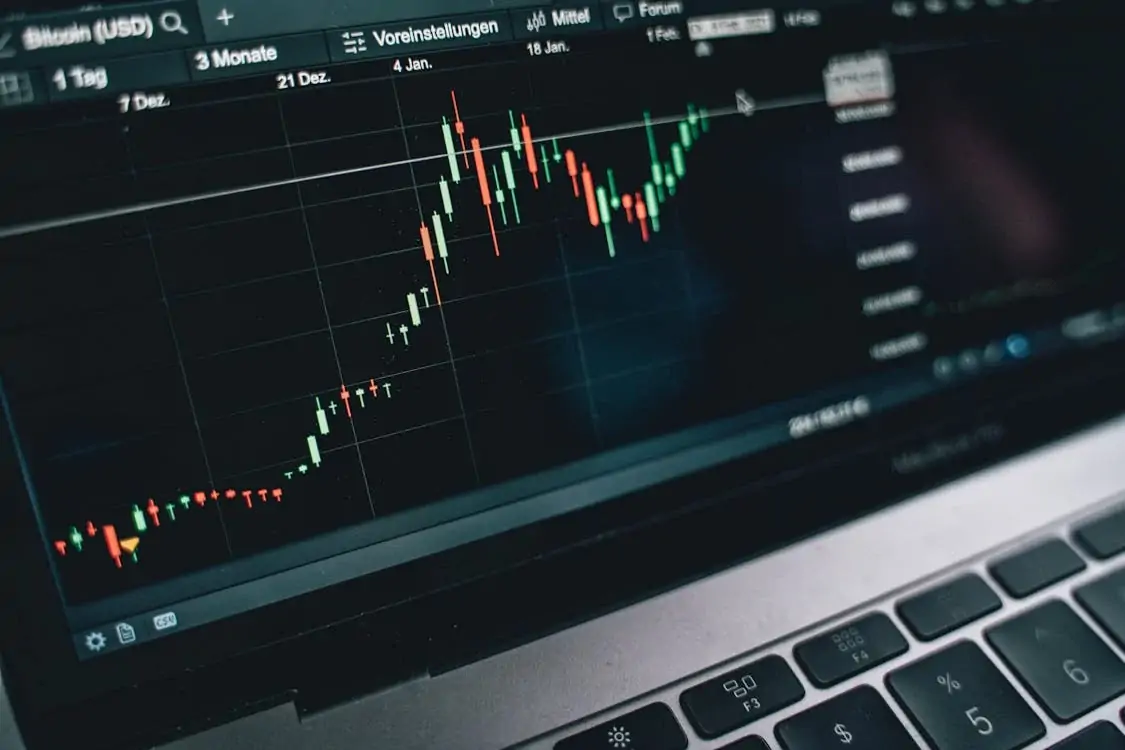
Financial charting is an art that brokers use to glean insights from complex data, as information is only valuable if it can be easily interpreted. Techniques to use in a brokerage context include:
Candlestick Patterns: These reveal market sentiment in a glance. Think of it as reading the mood swings of the market.
Moving Averages: Smooth out price data to identify trends over time. This is useful for cutting through the noise and spotting genuine movements.
Volume Indicators: Combine price and volume to validate trends. For example, a price rise with high volume suggests strong buyer interest.
Bollinger Bands: Measure market volatility using standard deviations. It’s like having guardrails on your trading highway, and you’ll know when prices are too high or low.
MACD (Moving Average Convergence Divergence): Tracks momentum by comparing moving averages. That way you can visualize shifts in market direction before they fully unfold.
Moreover, a powerful financial charting library can transform these techniques into actionable strategies, providing brokers with detailed visual representations that help make quick decisions during volatile markets.
Harnessing Big Data to Enhance Trade Decisions
There’s already an $8.78 billion market for financial analytics, and big data tools are continuing to have a transformative effect on how brokerages function from moment to moment. The potential of this tech encompasses:
Aggregated Market Insights: With big data, you compile vast amounts of market info from multiple sources. For instance, you can use real-time trading volumes and social media sentiment to make better decisions.
Risk Management: Data analysis identifies patterns that indicate potential risks – like spotting a leak in your roof before the storm hits.
Performance Analytics: Measure individual and portfolio performance with precision, and pinpoint which strategies work best under specific conditions, as opposed to relying on intuition alone.
Client Profiling: Create detailed client profiles for tailored investment advice. So in the case that your client prefers eco-friendly stocks, you can proactively suggest investments aligned with their values.
Predictive Modeling: Use historical data to forecast future market movements.
Put simply, big data is about making smarter decisions using the information available to your brokerage. Integrating these insights into your operations sets you up for better trades and happier clients.
Integrating AI for Improved Efficiency
Artificial Intelligence (AI) is a multifaceted tech niche, and one which is being adopted in finance in a range of ways, from accounting to fintech. For instance, while finance firms spent just $1 billion on generative AI last year, this is expected to top $9 billion by 2032. Here’s how integrating AI can boost your efficiency:
Automated Trading: Deploy AI-driven algorithms to execute trades. That way you can set up high-frequency trading systems that make split-second decisions which have more reliably favorable outcomes.
Data Processing: Use machine learning to process massive datasets quickly. This takes the big data ideals we discussed earlier, and brings them to a new plane of efficiency and effectiveness.
Sentiment Analysis: Analyze news and social media to gauge market sentiment. It’s a way of reliably knowing how the market feels before making a big move, without having to do everything manually.
Risk Management: Identify and mitigate risks in real-time using predictive analytics. Again, this is an evolution of the predictive modeling we touched on earlier, and shows how much of an overlap there is between AI and every other data-driven sphere of finance.
Customer Support Chatbots: Enhance client interactions with intelligent bots. Clients get immediate responses, improving satisfaction without stretching human resources thin. This has to be managed carefully, of course, since one survey found that poorly implemented chatbots can frustrate as many as 80% of people who encounter them.
Portfolio Optimization: Tailor portfolios based on AI insights into risk tolerance and goals. Being able to customize each investment plan with confidence, and automate much of this process, leaves human team members with more time and headspace for other tasks.
In short, integrating AI turns potential into performance, helping brokers operate smarter, faster, and more effectively than ever before.
Final Thoughts
Big data, financial charting solutions and AI are a worthy triumvirate to take a look into if you feel that your brokerage could do more with the data at its disposal. The initial learning curve may look intimidating, but it leads to decision-making nirvana.


